2014 Joint Mathematics Meetings
Anne Burns
Artists
Anne Burns
Professor Emerita (Mathematics)
Long Island University
Huntington, New York, USA
Statement
Visualization is an important aid in the study of mathematics. Often a diagram or graph can be understood more easily than pages of computations. In many of my courses, particularly those in math education, I have the students buy an inexpensive set of colored markers and use them in a variety of topics from abstract algebra to complex roots of a function.
Artworks
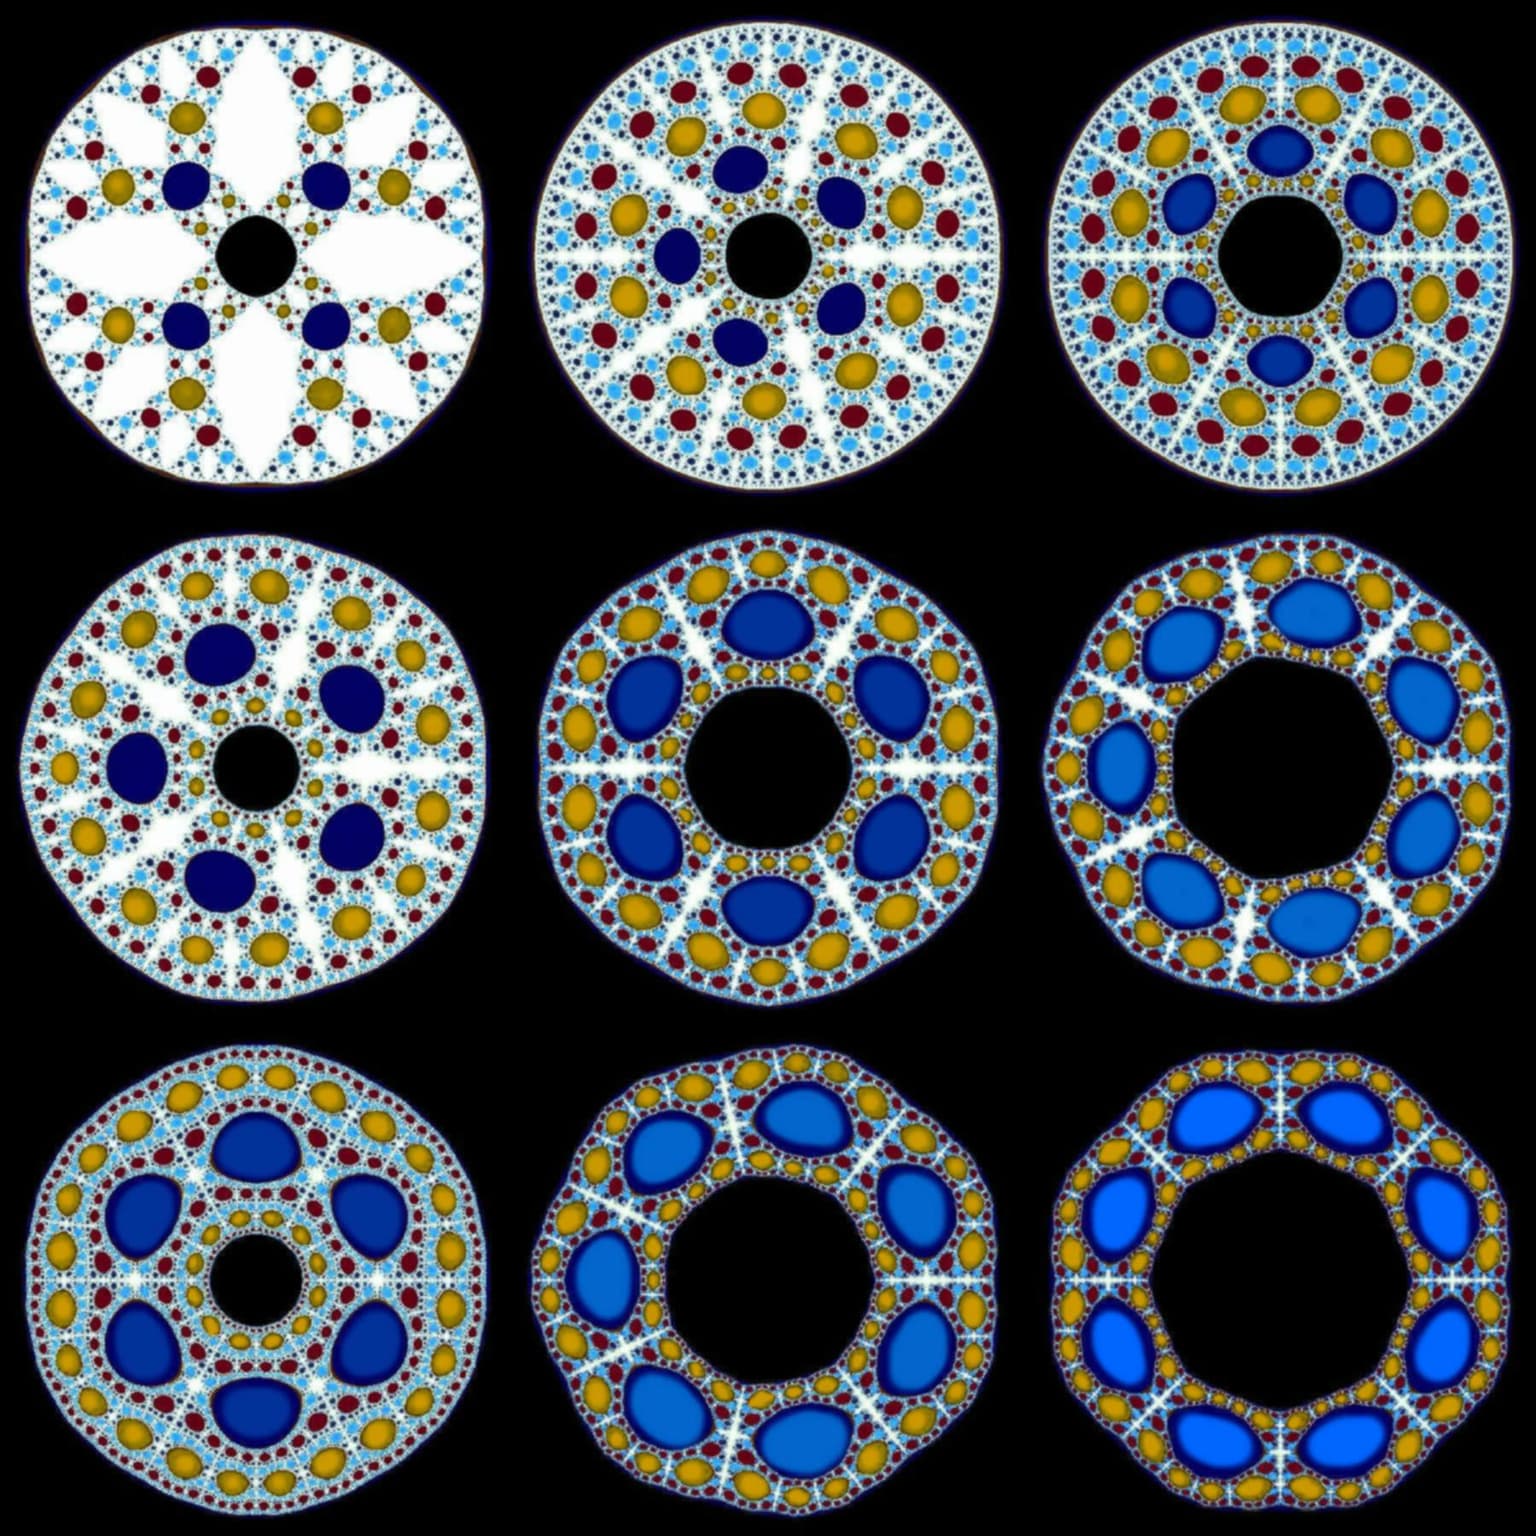
Visual Proof
13 inches by 13 inches
Digital print
2013
Each of the disks in the 3X3 matrix of disks is a picture of the first five backward iterations of f(z)=z^n+c/z^m where c is a small positive real number. The rows represent n=2,3,4 and the columns represent m=2,3,4. The black disks in the center consist of the set of points z such that |f(z)|>1.1. The second largest sets of disks are blue; they are the inverse images of the black disks under f; ochre disks are the inverse images of blue disks; red disks are the inverse images of ochre disks, etc. First notice the n+m symmetry in each disk. Next, can you identify n and m by this pattern? Hint: choose one blue disk in each entry and count the number of pre-images closer to the center and the number of pre-images further away from the center.