Robert Torrence
Artists
Robert Torrence
Student
The College of William & Mary
Williamsburg, Virginia, USA
Statement
I was lucky to grow up in a home filled with mathematical art, so when generating graphs for my research I appreciated the artistic nature of the visualizations. By shifting parameters, colors, and groupings I was better able to reveal relationships that were buried in the data, and to highlight the complexity and symmetry that exists in the image.
Artworks
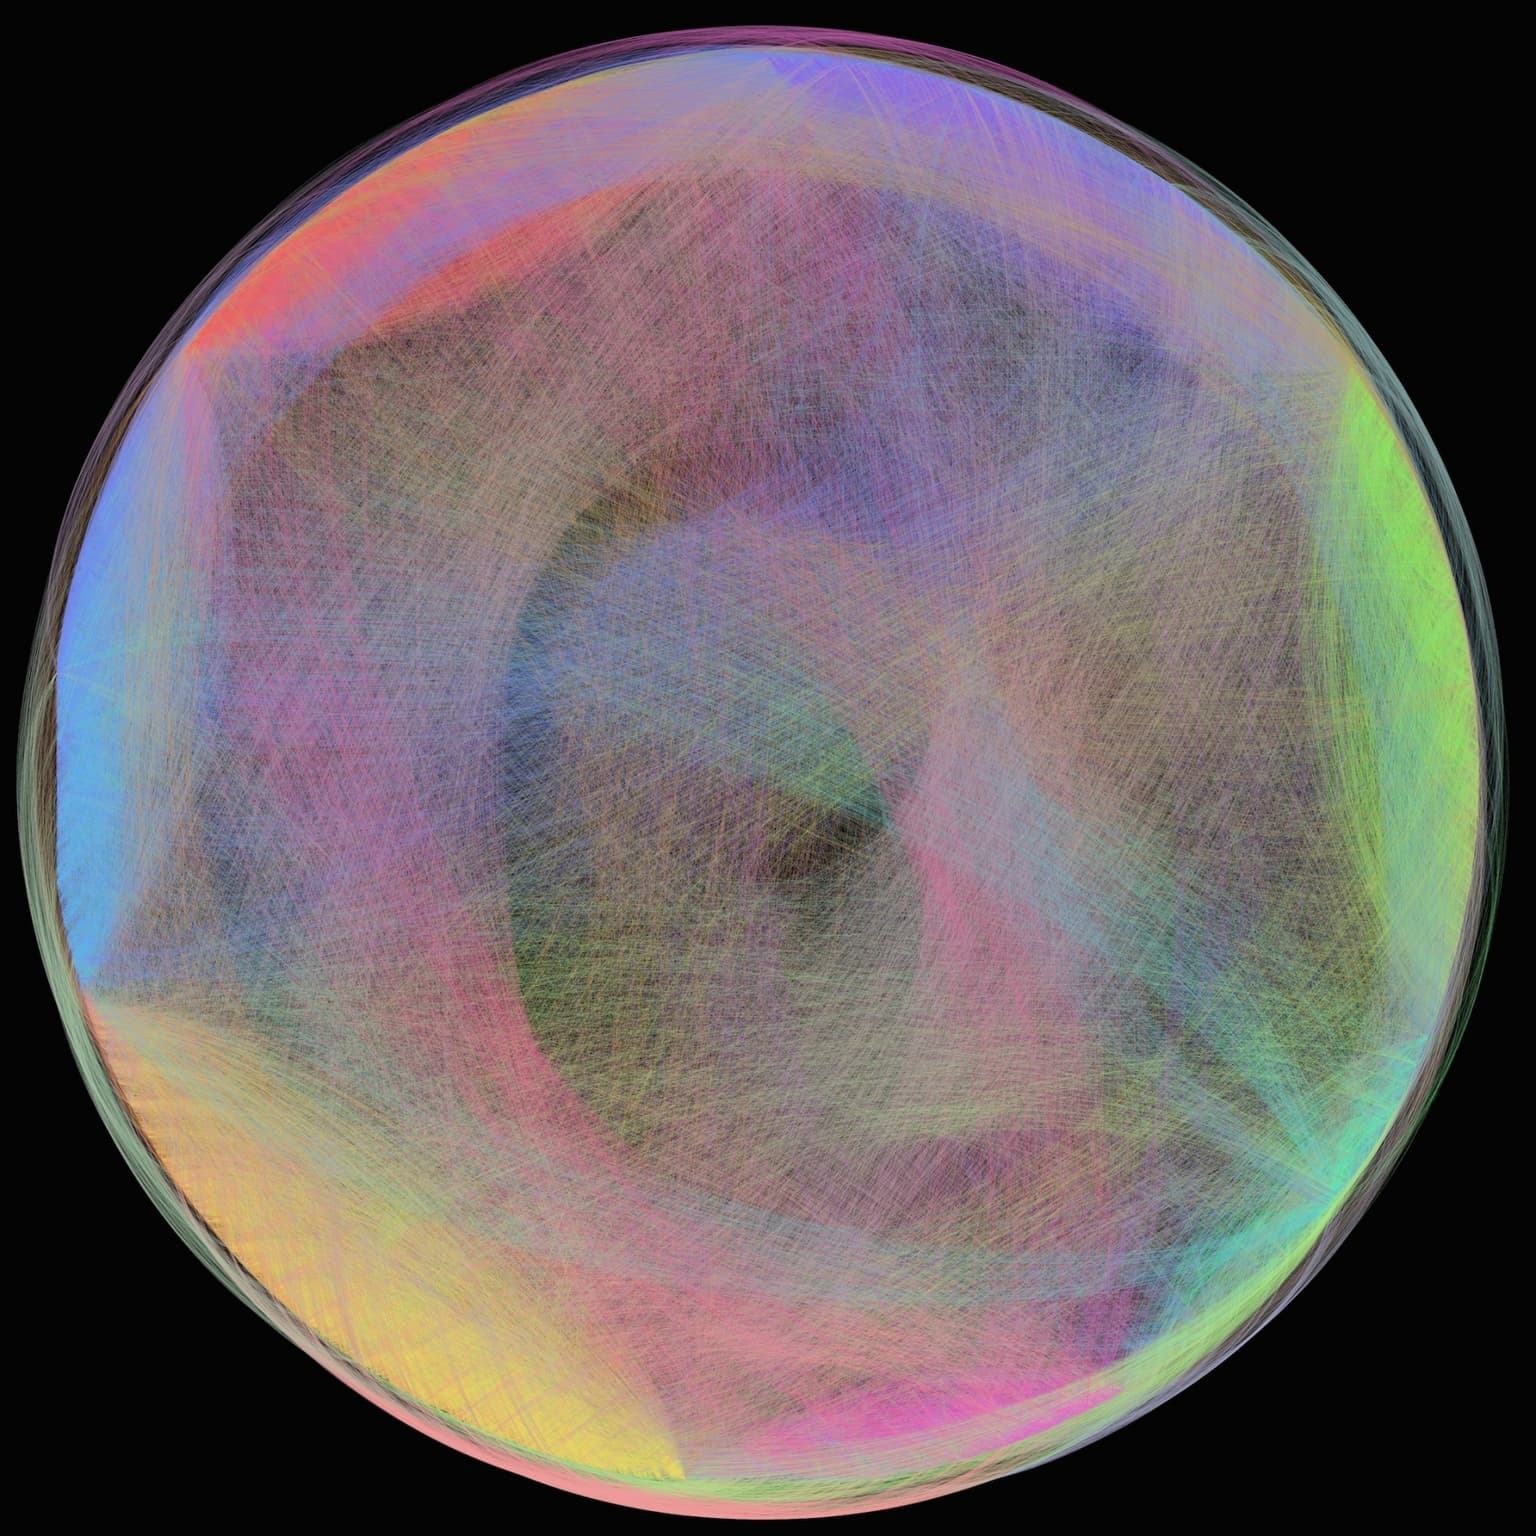
Community
60 x 60 cm
Archival Inkjet Print
2014
This image is a visualization of a large social network mined from an online bulletin board system in which nodes are users, edges are connections made online, and multiple connections between two users are represented in the weight of the edge. This large subgraph contains 6341 nodes and 70859 edges. It is part of a larger network (with the sum of all edge weights being over 600,000). By removing those nodes that were not connected to users with a long lifetime in the network, I created this graph, which has a stronger community structure.
This visualization was created by arranging the nodes in a circle, and sorting and coloring them by community. The image was rendered using Gephi.