2022 Joint Mathematics Meetings
Pallavi Natarajan
Artists
Pallavi Natarajan
Chemical Engineering Student
Georgia Institute of Technology
Statement
I am a chemical and biomolecular engineering student and enjoy creating digital and fractal art. Through these creations, I explore the connections between math and art.
Artworks
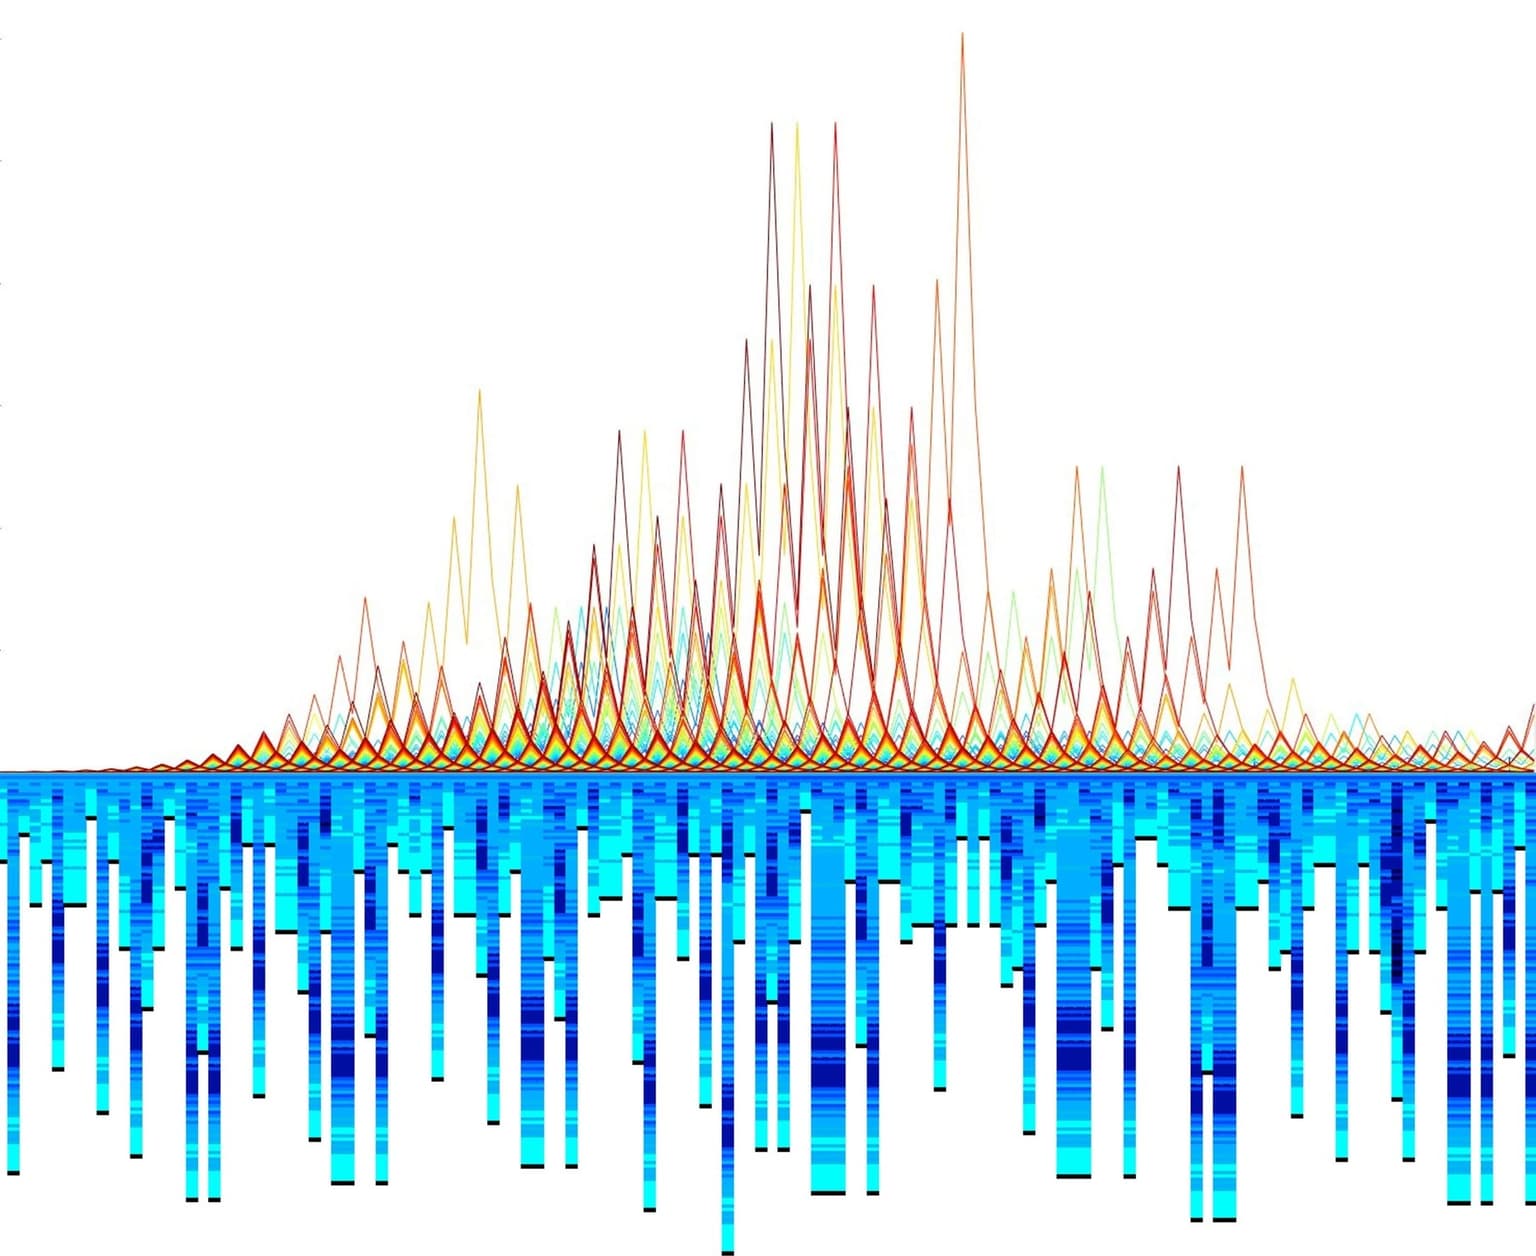
Waterfalls
30 x 30 cm
Archival print on paper from digital image
2021
The rainbow colorful upper portion is a graph of the Collatz Conjecture. Every odd number from 1 to 20,000 was plotted with the coordinates of the number and the next value in the conjecture. For example, 7 was plotted as (7,7), then (7,22), then (22,11) and so on. The 4-2-1 loop was excluded to prevent infinite running time.
The bottom blue portion is a different graph of the Collatz conjecture, where each column represents one odd number. The sequence begins at the top of the chart and each step in the conjecture is represented using an additional rectangle. Longer sequences have longer columns. Additionally, the color of each rectangle represents a set of values, with darker rectangles representing numbers in the thousands range.