Ally Stacey
Artists
Ally Stacey
Graduate Student in Mathematics
Department of Mathematics, Oregon State University
Corvallis, Oregon, USA
Statement
I draw my math research in crayon. I come up with examples of what I need to study or notes of visual proofs and draw them in pencil, cover it in sharpie, color it in and make interesting backgrounds.
Artworks
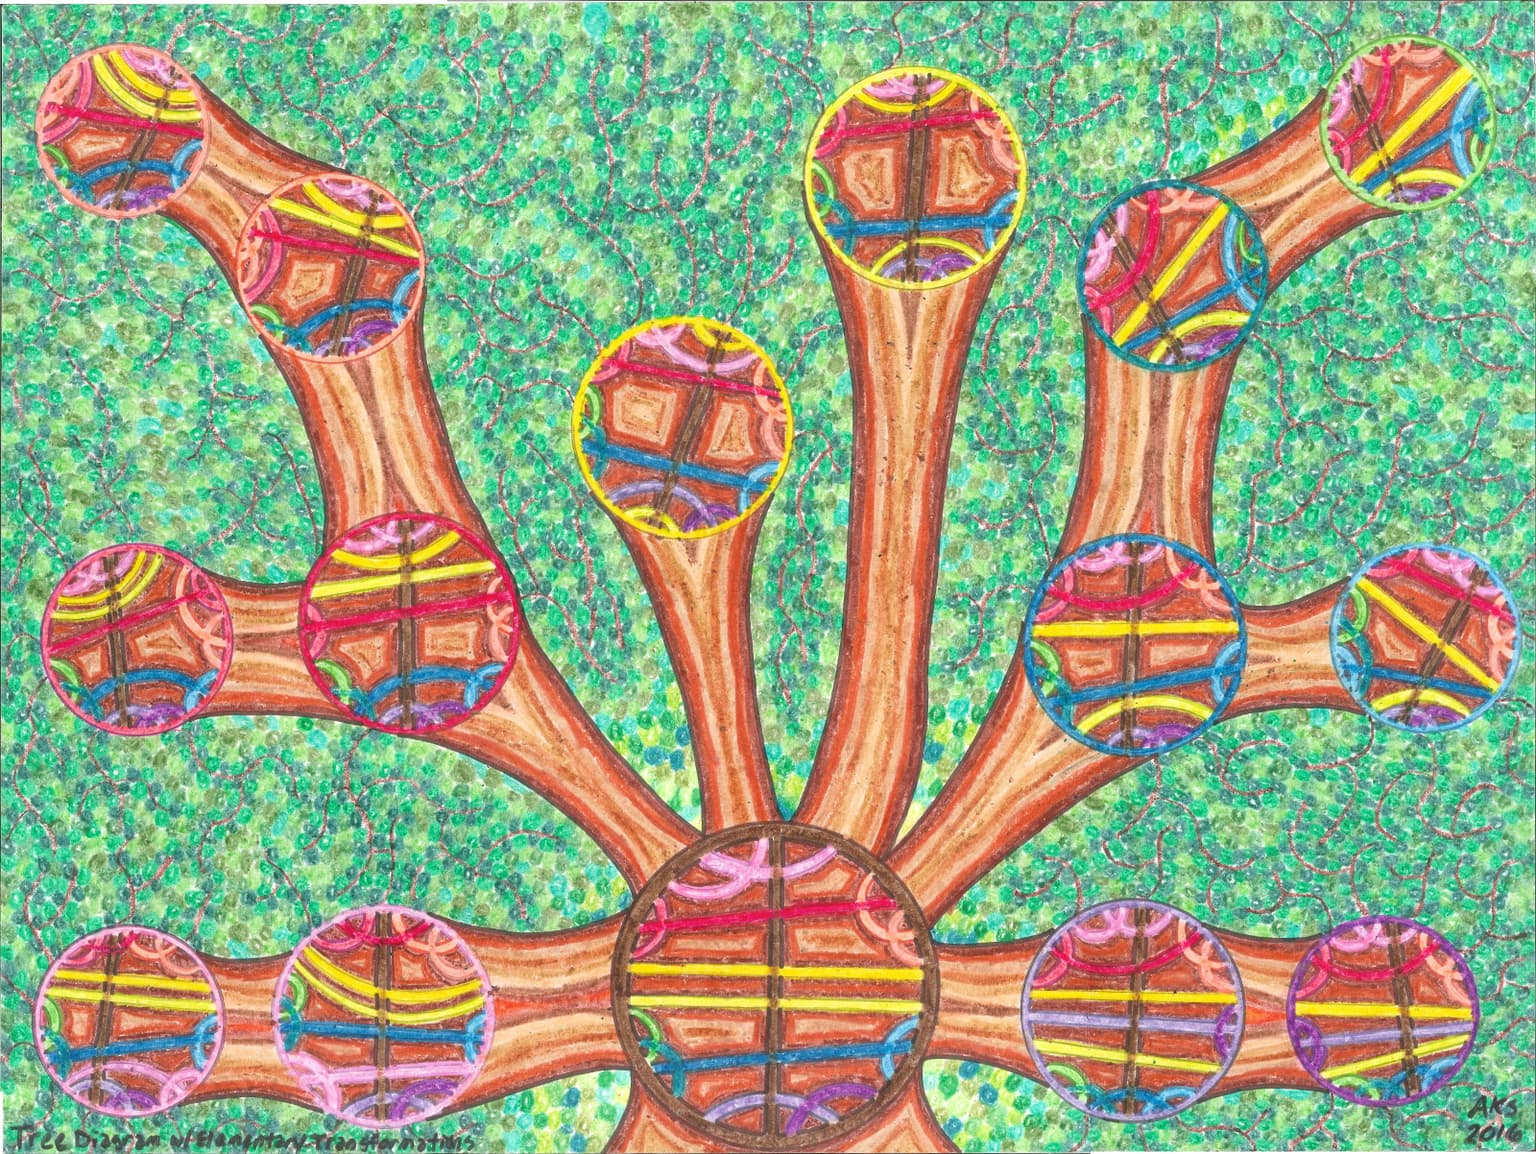
Tree Diagram with Elementary Transformations
45 x 60 x 2 cm
Sharpie, Crayon
2016
Similar to "2 Loops 1" this is an intersection graph with color-coded chord diagrams on the vertices. When the intersection graph is a tree we can pick a chord called the trunk and the chords intersecting it are called boughs. Permuting boughs along any trunk is an "elementary transformation" that preserves the intersection graph. Initially I chose the brown chord as the trunk and permuted the boughs 6 ways. Then I chose the chords the new diagrams represent as the trunks and permuted their boughs moving out. For example, the lower left I let the pink chord be the new trunk.
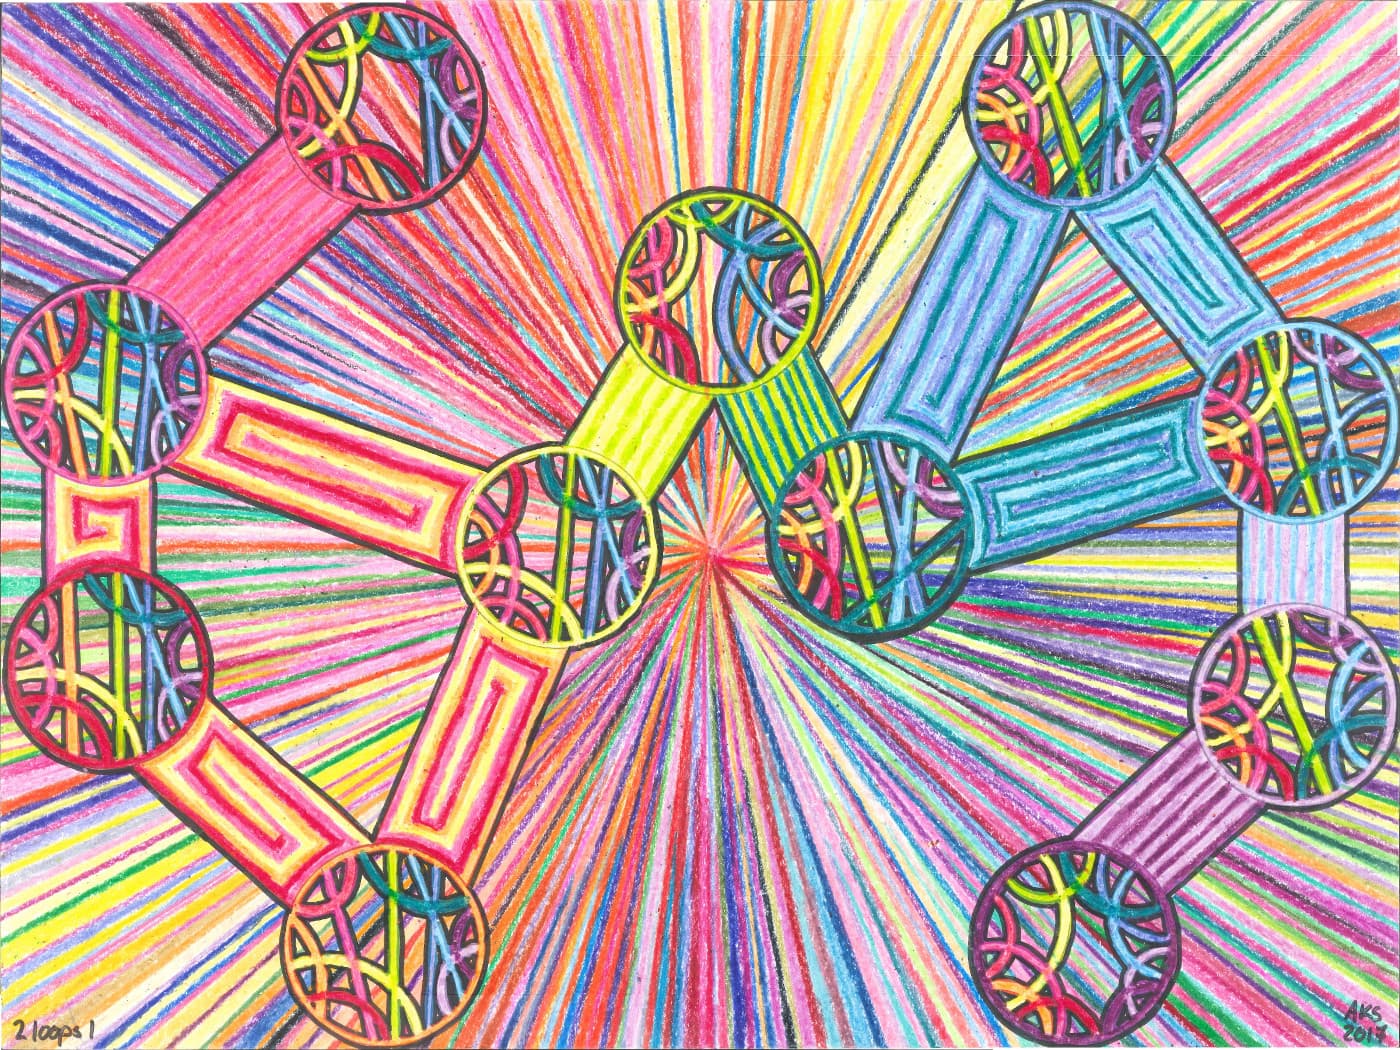
2 Loops 1
45 x 60 x 2 cm
Sharpie, Crayon
2017
The circle objects are called chord diagrams and the lines and arcs inside the circle are called chords. The intersection graph of a chord diagram is a graph with vertices representing the chords and lines between them if the chords intersect. Here I drew chord diagrams on the vertices of their intersection graph. The color of the circle indicates which chord inside it represents. These are 11 unique chord diagrams sharing this graph as their intersection graph.