2025 Bridges Conference Math + Fashion
Jill Borcherds
Designers
Biography
For 30 years, I taught maths to secondary school students aged from 11 to 18; including older students studying a large data set of climate data from around the world, provided by the examination board Pearson for their A Level Maths statistics examination. Meanwhile, beyond the classroom, I saw the "warming stripes", a powerful visual representation of temperature data from across the globe, created by Professor Ed Hawkins at the University of Reading. https://showyourstripes.info/ Having seen the striking image and inspired by the call to #ShowYourStripes, I decided to make a wearable version in the form of a crochet scarf - an accessible conversation starter about data associated with climate change and global warming. The data set I chose to use was for the UK since 1884; I now continue to add additional stripes each year as the latest data is released. The yarn used is an organic cotton which was available in 16 different blue, pink and red tones. I wanted to avoid using acrylic and this yarn is marketed as "more sustainable, natural, and bio-degradable". I know that this choice was still a compromise but hope that I have made a long-lasting piece, not fast fashion destined for land fill after a few months. I chose the wavy pattern to add visual interest, a more natural look – it also made the crochet process more interesting. Making the scarf was itself thought provoking, as the stripes moved from cool blues to warmer pinks and then reds. The first time I used the darkest red to represent the hottest temperatures, then again, and then for two years running was very sobering.
Looks
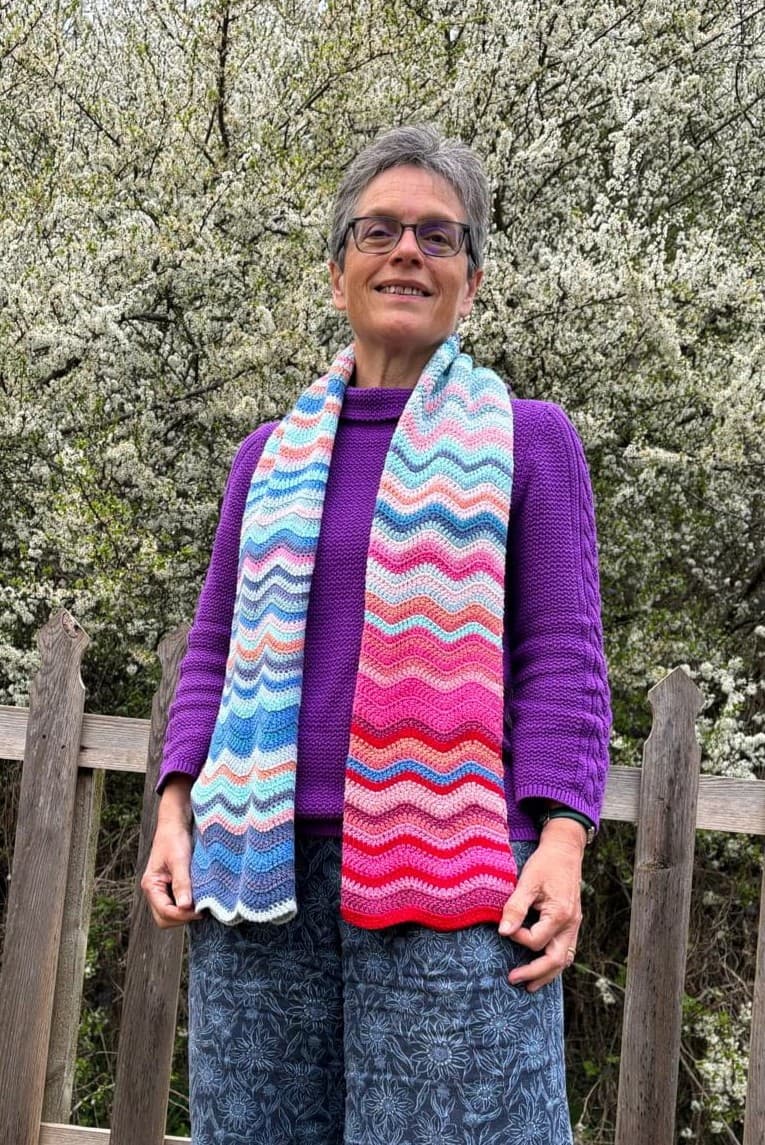
Climate Scarf worn in April 2025 with UK temperature data 1884-2024
Model - Jill Borcherds Photo - Nadia Shahumi Jumper - Hobbs Trousers - Seasalt Cornwall
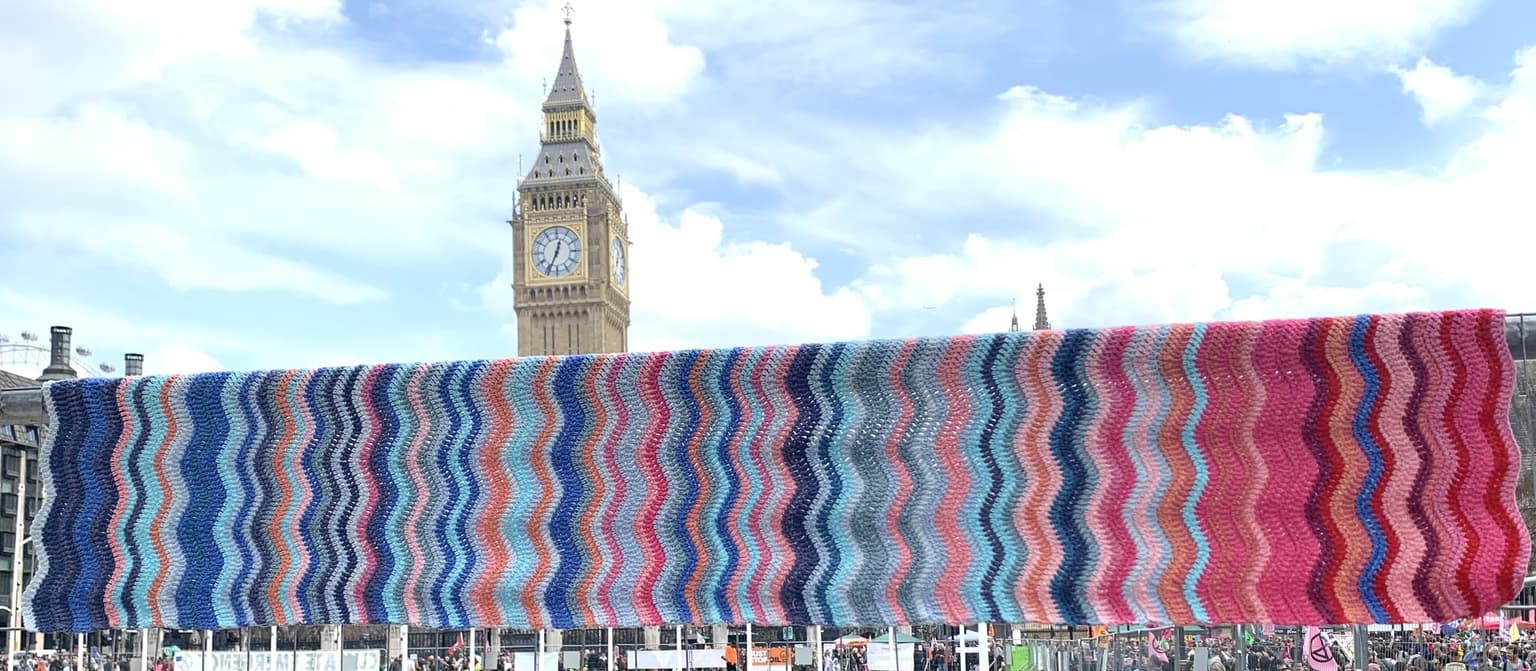
Climate Scarf outside the Houses of Parliament, London, April 2023, with UK temperature data 1884-2021
Photo - Jill Borcherds
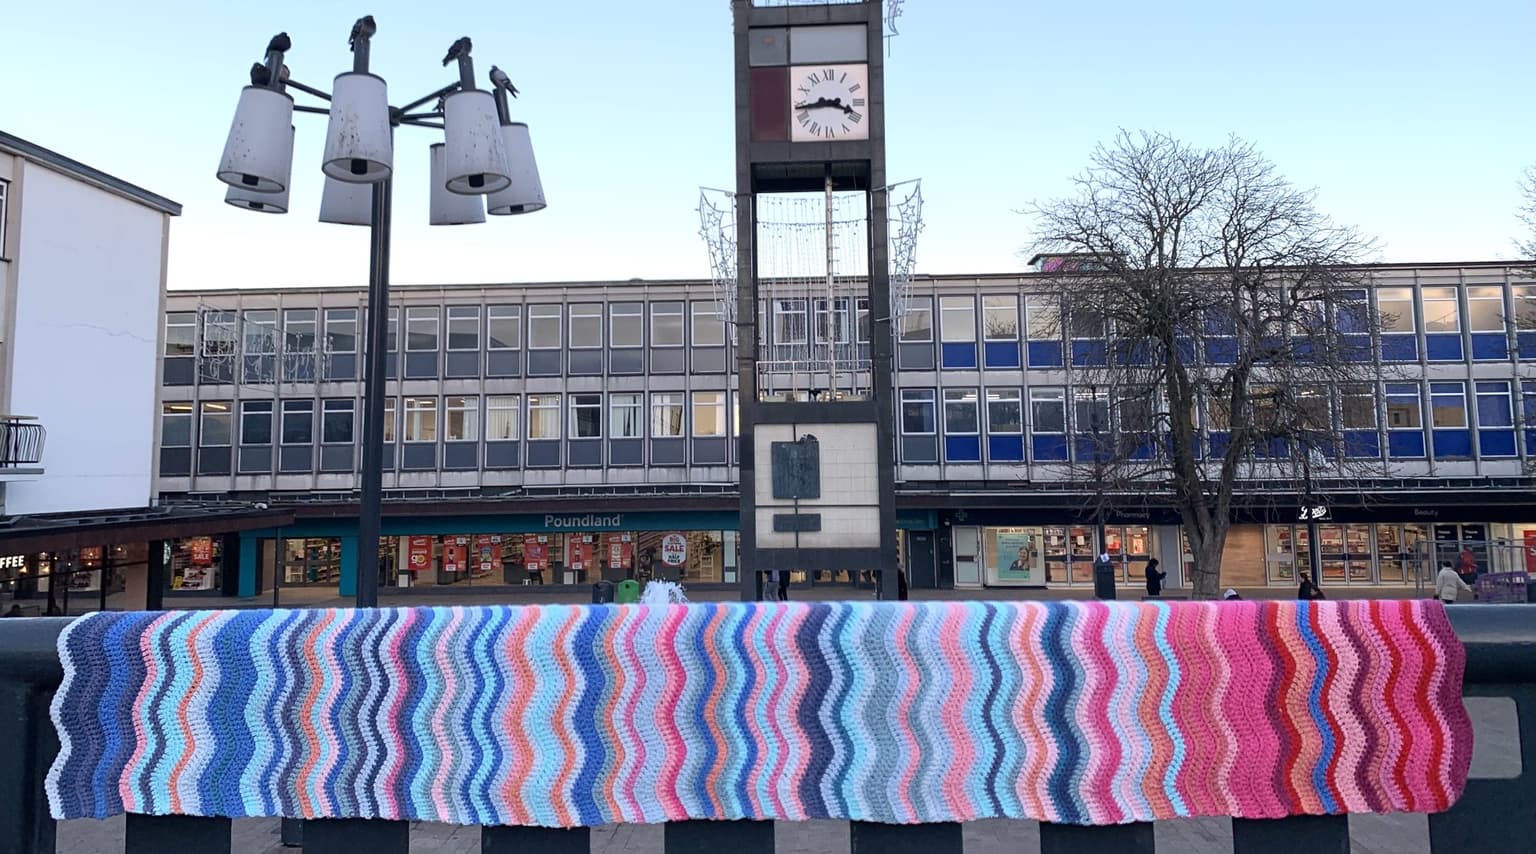
Climate Scarf in the Town Square, Stevenage, Hertfordshire, January 2024, with UK temperature data 1884-2023
Photo - Jill Borcherds
About the look
Show Your Stripes Climate Scarf with UK temperature data 1884-2021
Organic cotton double knit yarn
Initially 2023 but remains unfinished