2026 Joint Mathematics Meetings
Melissa Houck
Artists
Melissa Houck
Actuary that dabbles in mathematical art
Philadelphia, Pennsylvania, USA
Statement
I enjoy reading “popular math” books that bring mathematical concepts to life in layman’s terms. As an actuary who uses Excel in my work, I find myself using the spreadsheet program to visualize and help me understand the topics I read about. Inspired after reading Chaos by James Gleick, I used Excel to create a starting grid of complex numbers, then map them using a complex function. After several iterations, Excel’s conditional formatting reveals a beautiful pattern. What impact would different starting grids have on the final result?
Artworks
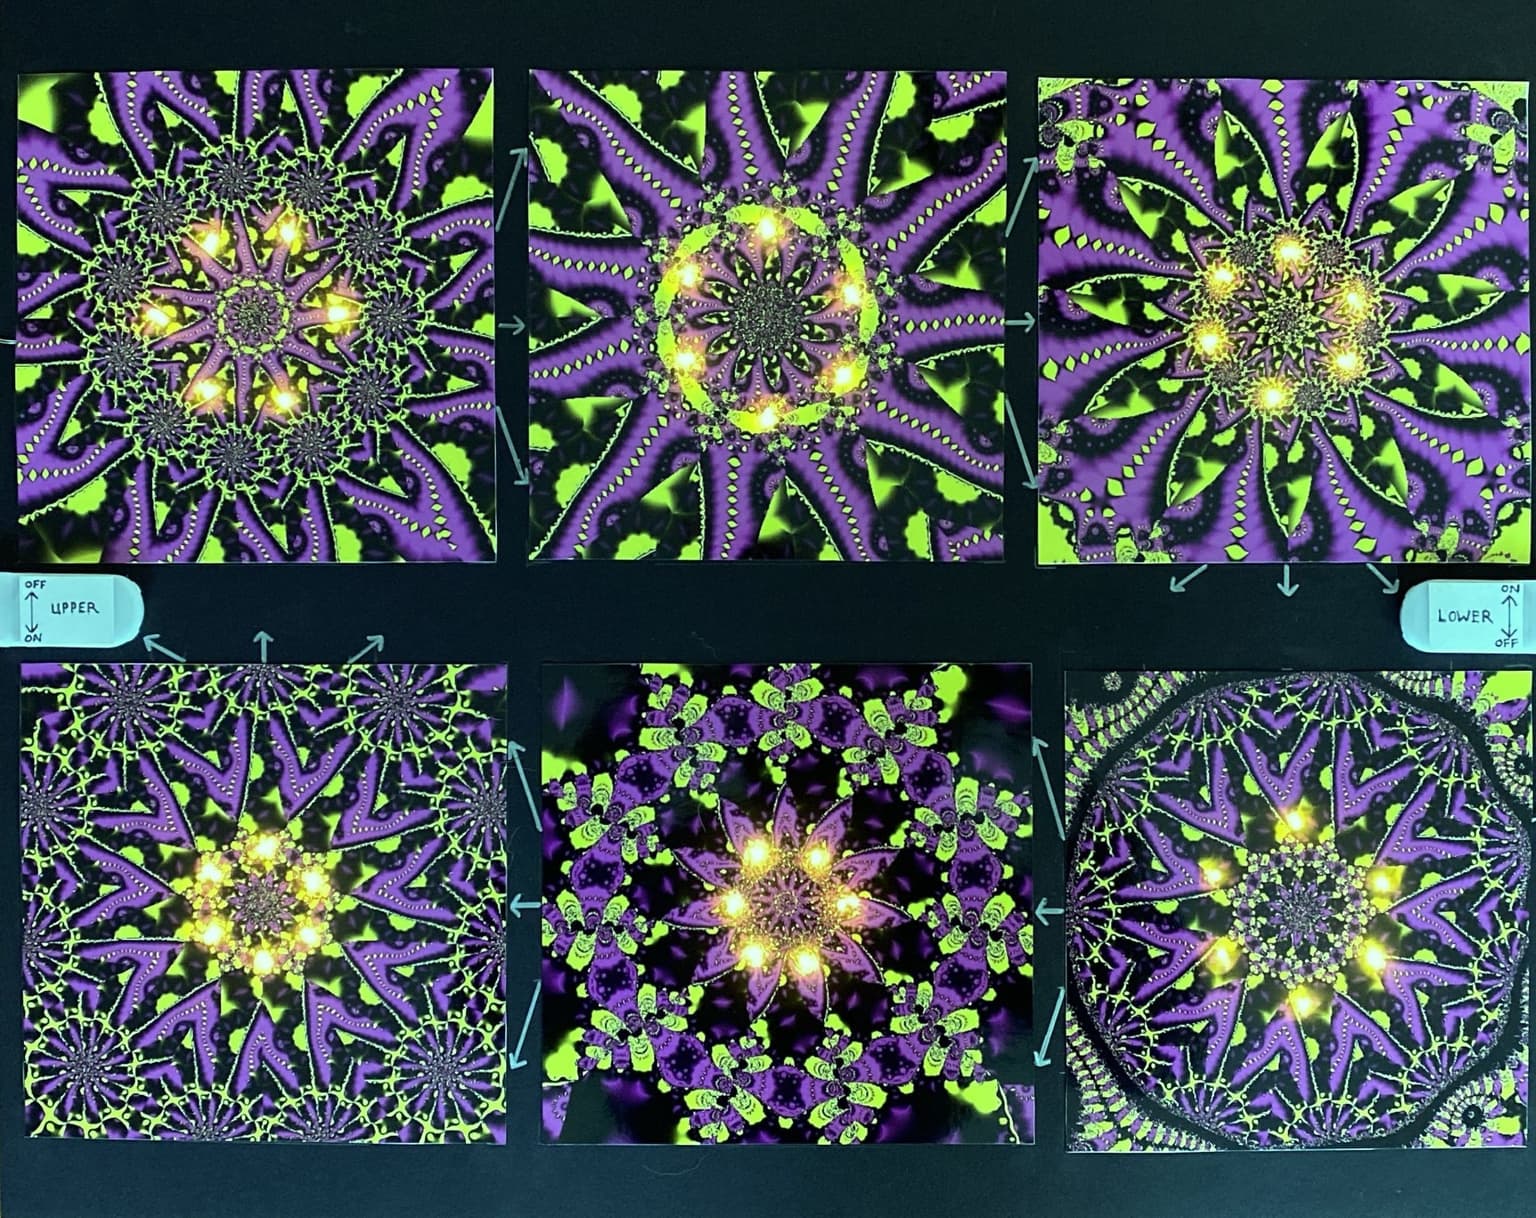
Zooming in on a Complex Function
40.6 x 50.8 cm
6 prints on foam board with fairy lights
2025
I used Excel to create a grid of complex numbers, then iterated the grid 10 times using the mapping z2 = z1^[-11 + .1i] with the exception of the 5th iteration, which was Exp[4th iteration]. I then applied conditional formatting to the absolute value of the final grid. Starting with the upper left and going clockwise, the 6 prints represent 6 different starting grids, each different by a factor of ten. This had the effect of “zooming in” on the center of the previous print. If the lights are turned on, they illuminate a circle around the portion of the print which is zoomed in to create the next print. I was surprised to see that the 6th zoom-in gets you back to the first!