Artists
Melissa Houck
Actuary that dabbles in mathematical art
Philadelphia, Pennsylvania, USA
Statement
I enjoy reading "popular math" books that bring mathematical concepts to life in layman's terms. As an actuary who uses Excel in my work, I find myself using the spreadsheet program to visualize and help me understand the topics I read about. Inspired after reading Chaos by James Gleick, I used Excel to create a rough facsimile of the familiar Mandelbrot fractal by using the mapping $f(z) = z^2 + c$, and iterating it several times, where the $z$'s are complex numbers. But why $z^2 + c$? Why not use a complex power? What about other functions, like a trig function? What if the starting grid were changed? What is the impact of making a small change in assumptions?
Artworks
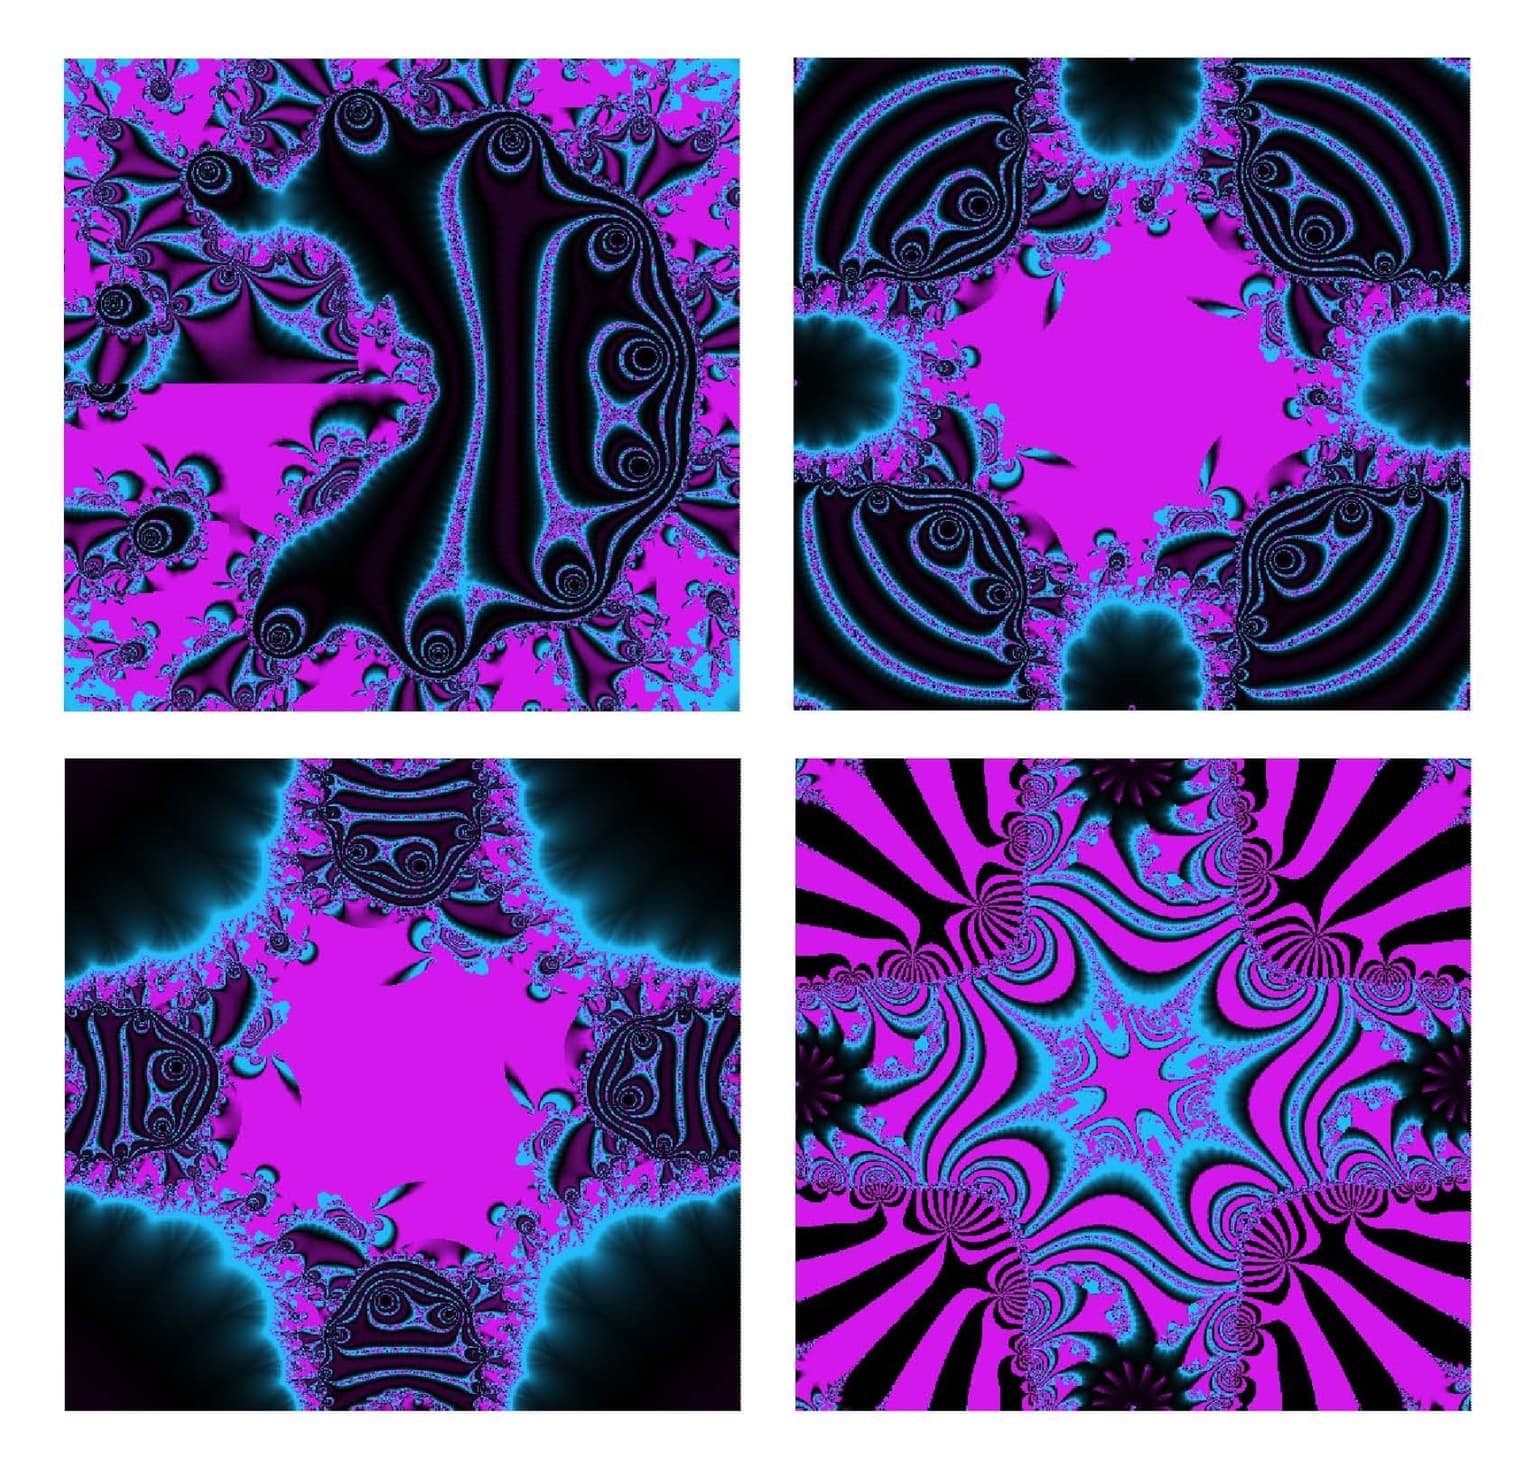
Spreadsheet Chaos
47.5 x 47.5 cm
prints mounted on mat board
2024