Artists
Melissa Houck
Actuary that dabbles in mathematical art
Philadelphia, Pennsylvania, USA
Statement
I enjoy reading books and articles that bring mathematical concepts to life in layman’s terms. As an actuary who uses Excel in my work, I find myself using the spreadsheet program to visualize the topics I read about. I was inspired after attending the 2024 Bridges Richmond session “The Heart of Domain Coloring” [Reitebuch et. al.] that discussed ways to visualize complex functions, using colors that represent characteristics of the results. I wanted to see what it would look like to apply a function to a 2D grid of complex numbers and use the result to define the new position of each point in the range grid, then assign a color to that point based on the color of the domain point that generated that result.
Artworks
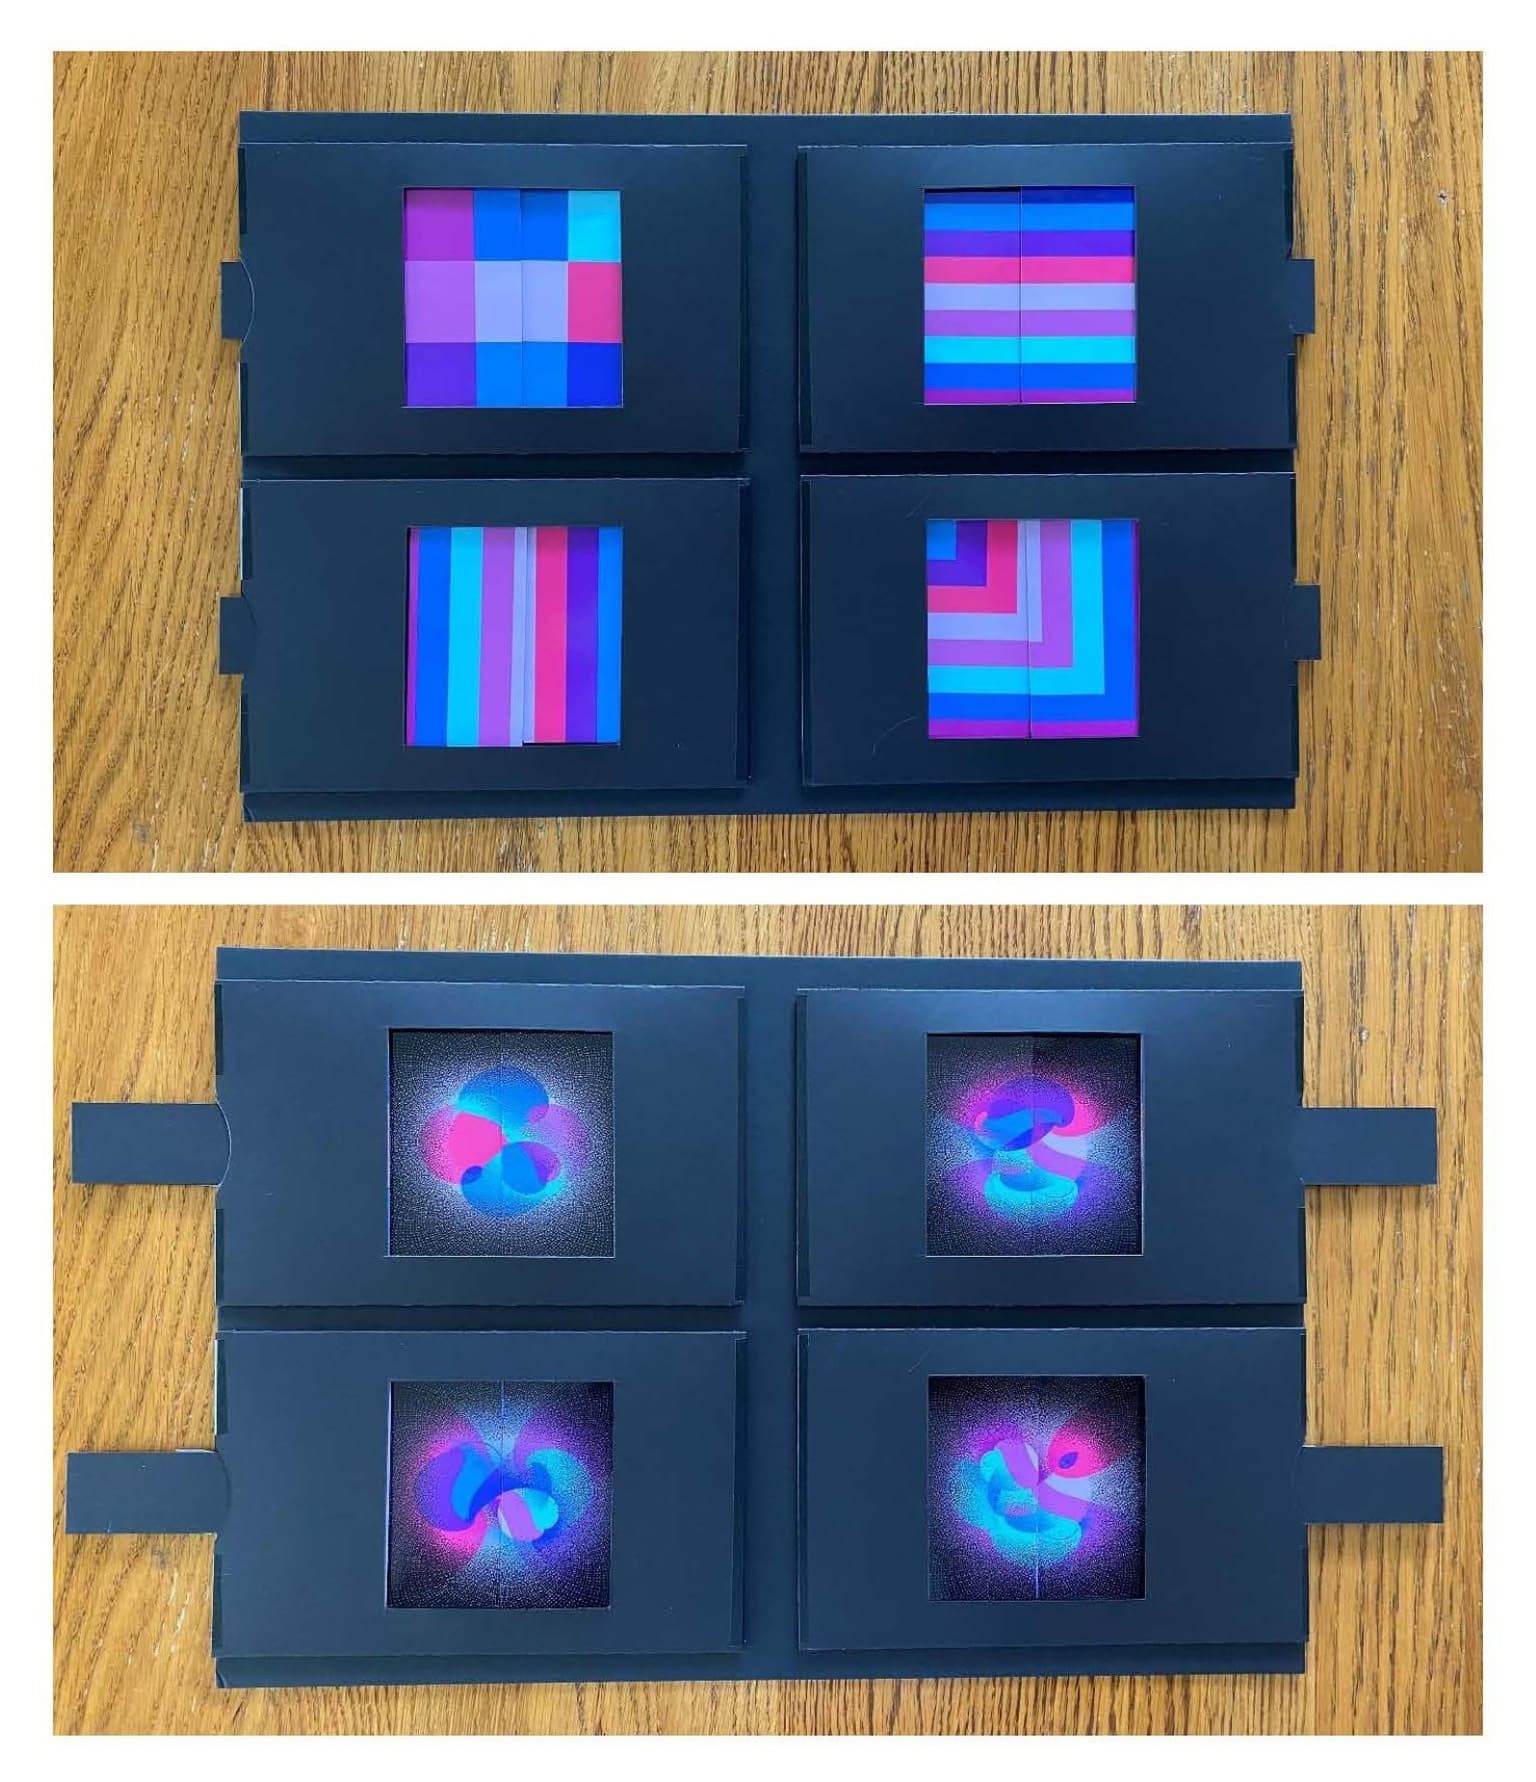
Domain Reflections 1
30.48 x 45.72 cm
mat board, cardstock, photo prints
2026
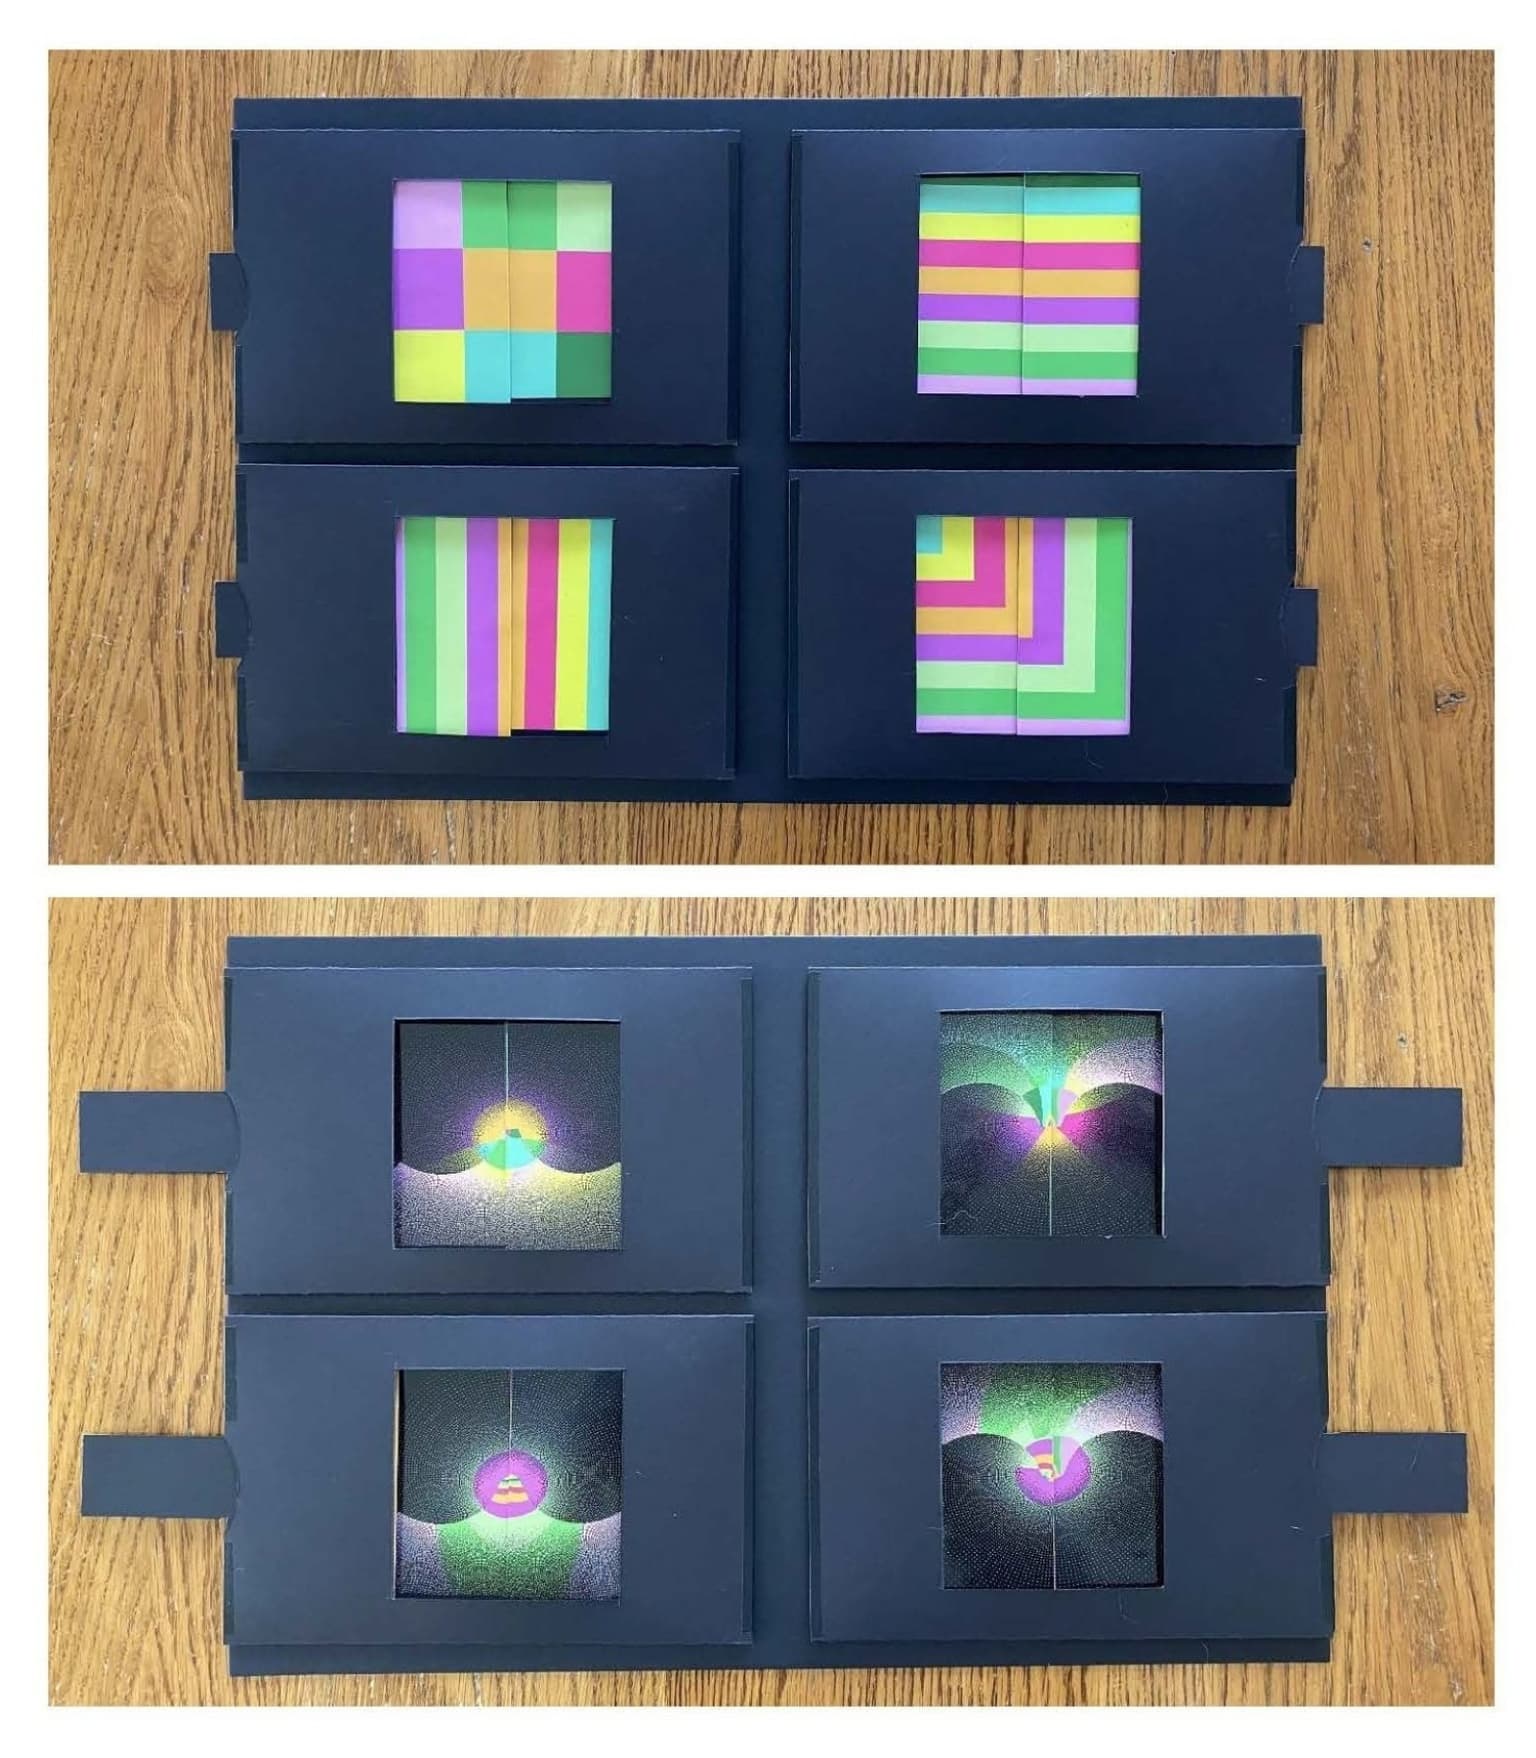
Domain Reflections 2
30.48 x 45.72 cm
mat board, cardstock, photo prints
2026